The Work
Define the advancement problem
I started with two questions. What does it cost when an employee leaves because the advancement path is blocked? And how much tactical work could move from managers to a senior technician role with a higher responsibility threshold? Looking at both kept the analysis tied to the operation rather than treating the issue only as a pay increase.
The staffing scenario uses 42 technician positions: 30 Tech 2s and 12 Tech 3s. Promoting seven technicians changes that mix to 23 Tech 2s and 19 Tech 3s without adding headcount. The proposal replaces the fixed-position gate with readiness criteria and a clearer definition of the work expected at the senior level.
Compare compensation in context
I compared job postings, public filings, salary references, and workforce information to understand the compensation context. Colorado postings were useful because their disclosed pay ranges made comparisons possible where other advertisements provided little detail. I separated base pay from stock compensation and considered geography, experience, and role responsibilities.
For the model, I used $37 per hour for Tech 2 and $43 per hour for Tech 3. Those rates define the $6 increase used throughout the calculation. Keeping one consistent baseline matters: substituting a regional pay range or a different proposed role halfway through would change the investment without changing the rest of the scenario.
Calculate the first-year wage cost
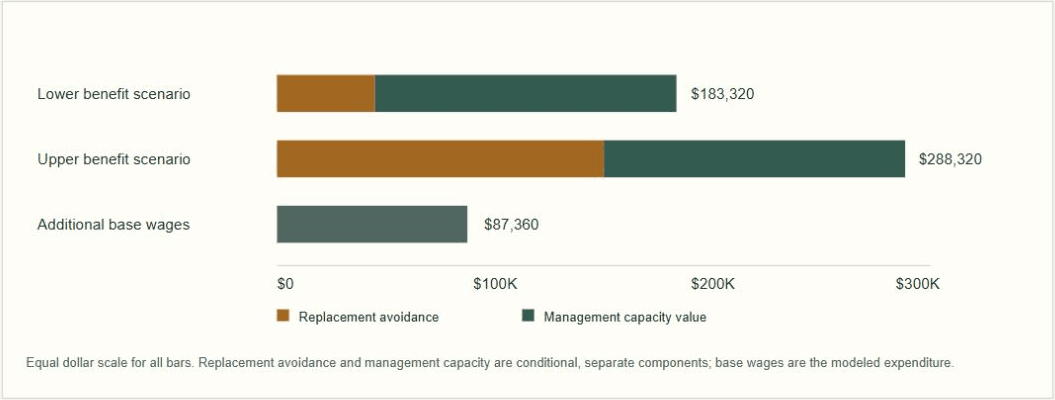
Seven promotions, a $6 hourly increase, and 2,080 annual hours produce $87,360 in additional annual base wages: 7 × $6 × 2,080. Each promotion adds $12,480 per year. I kept that recurring expenditure separate from the potential benefits so the comparison starts with a clear cost.
The wage difference is only one part of a staffing decision. The expanded role also needs defined responsibilities, training, and agreement on which tasks can move. A promotion that changes the title and pay without changing the work would not create the management capacity included in the model.
Separate replacement cost from management capacity
I modeled three to five avoided replacements at $15,000 to $30,000 each, producing a $45,000 to $150,000 range. I also estimated 38 weekly management hours across eight task groups that could move into the expanded senior role. At $70 per hour over 52 weeks, that time has an annual value of $138,320.
Those benefits have different meanings. Avoided replacement costs depend on retention improving. Management capacity depends on work actually moving and the released time being used productively. The manager's salary remains in the budget, so the capacity figure is a value assigned to available time, not a reduction in payroll.
- Shift scheduling: 6 hours per week
- Preventive-maintenance tracking: 4 hours
- Work-order prioritization: 5 hours
- Spare-parts inventory management: 3 hours
- Breakdown-response coordination: 8 hours
- Technician-training coordination: 4 hours
- Equipment-downtime reporting: 3 hours
- Root-cause documentation: 5 hours
| Component | Lower scenario | Upper scenario |
|---|---|---|
| Avoided replacements | $45,000 | $150,000 |
| Management capacity value | $138,320 | $138,320 |
| Combined gross benefit | $183,320 | $288,320 |
| Additional base wages | $87,360 | $87,360 |
| Combined net benefit | $95,960 | $200,960 |
| Net excluding capacity value | −$42,360 | $62,640 |
Carry the wage cost into later years
I extended the model with seven new promotions in year one, five in year two, and three in year three. Earlier wage increases continue, so annual wage costs rise with the total promoted cohort. I held the annual replacement and capacity benefits constant to see how the proposal behaves without assuming that each expansion automatically produces more value.
The three-year combined net range is $125,640 to $440,640. The lower annual result falls below zero in year three as recurring wages grow. A positive first year supports evaluating an initial step, but it does not justify expanding indefinitely under the same benefit assumptions.
| Year | New / total promotions | Annual added wages | Annual net, lower | Annual net, upper |
|---|---|---|---|---|
| 1 | 7 / 7 | $87,360 | $95,960 | $200,960 |
| 2 | 5 / 12 | $149,760 | $33,560 | $138,560 |
| 3 | 3 / 15 | $187,200 | −$3,880 | $101,120 |
| Three-year total | 15 total | $424,320 | $125,640 | $440,640 |
Turn the model into a decision
I connected the financial comparison to a phased recommendation in an executive summary and stakeholder presentation. The first step is to define readiness criteria, agree on task ownership, and evaluate the seven-promotion scenario. The model makes it possible to discuss which assumptions are reasonable before committing to a broader change.
I proposed tracking departures, replacement spending, task transfers, and management hours released during a pilot. Those measures would show whether the expected benefits are materializing and provide better inputs for the next decision. My contribution was to turn an operational concern into a structured business case that leadership could evaluate, revise, and measure.
THE DELIVERABLES
What I delivered
- Compensation and role research comparing public pay disclosures and responsibilities
- Python model covering first-year costs, benefit scenarios, and recurring three-year wages
- Task-hour breakdown separating management capacity from replacement costs
- Executive summary and stakeholder recommendation for a phased change
THE OUTCOME
Where the work stands
The analysis connected advancement, retention, and management workload in one business case. It showed where the first-year proposal could create value and how additional promotions change the longer-term balance. The resulting recommendation is a proposal for evaluation; the projected benefits are not implemented savings.
SCOPE AND LIMITATIONS
What the work establishes
The model uses estimated task hours, replacement costs, and wage assumptions. Its results depend on retention and task transfer.
Management capacity represents time available for other work, not cash savings.
The comparison excludes employer payroll costs, benefits, stock compensation, overtime, training, and rollout expenses. The three-year totals are undiscounted.